Mutual Funds Explained: How They Work, Types, Benefits, Risks and Investing Guide
Navigating the world of personal finance can often feel like deciphering a foreign language. With terms like asset…
Read article →

When you first start exploring mutual funds, you are immediately greeted by financial jargon, tables, and fluctuating figures. Among all these numbers, one metric stands out on every fund factsheet: Net Asset Value, or NAV. At first glance, NAV looks like a standard stock price. You might see one equity fund priced at $10 per unit and another at $100 per unit. It is easy to assume that the $10 fund is a bargain and the $100 fund is expensive. However, in fund investing, initial appearances can be misleading. Understanding mutual fund NAV: how it’s calculated and why it matters is essential for making informed investment decisions. In this guide, we will break down what NAV actually means, walk through the step-by-step formula, debunk common misconceptions, and explain how to use it effectively in your wealth-building strategy.
Net Asset Value (NAV) represents the per-unit market value of a mutual fund scheme. In simple terms, it is the official price tag at which you buy or sell individual units of that fund on any given day.
When you invest in a mutual fund, your money is pooled together with capital from thousands of other investors. The fund manager uses this collective capital to buy a portfolio of assets, such as shares, corporate bonds, government gilts, or cash equivalents.
Because a mutual fund holds dozens or even hundreds of individual securities, its underlying value changes constantly throughout the trading day. However, unlike individual stocks or Exchange-Traded Funds (ETFs) that trade continuously on a stock exchange, traditional open-ended mutual funds are priced only once per day. That single daily closing price is the Net Asset Value.
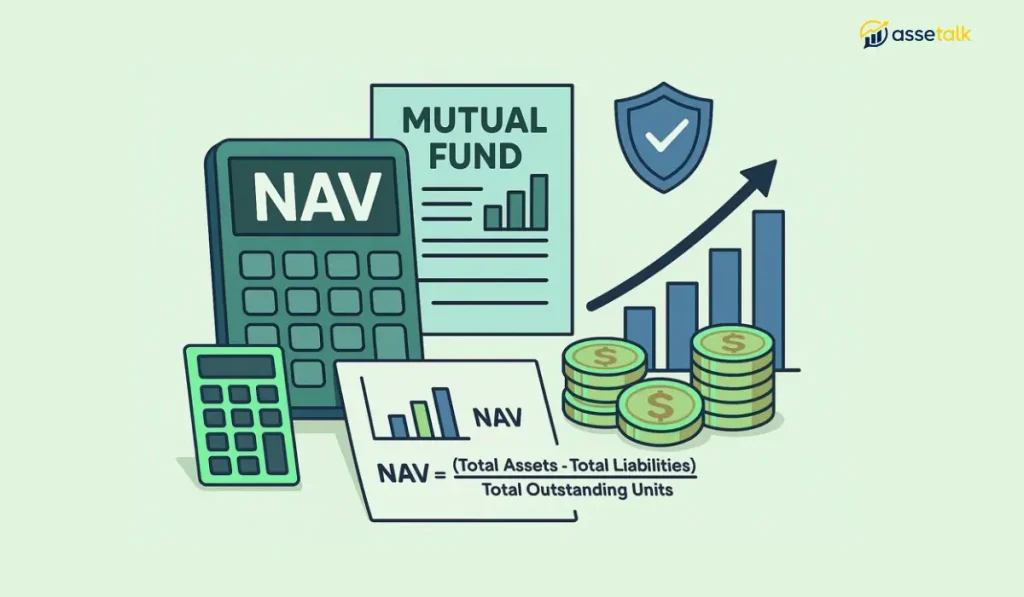
Calculating a fund’s NAV might sound like a task for complex financial software, but the core formula is remarkably simple. To determine the NAV per unit, fund administrators calculate the total market value of all investments held by the fund, subtract any outstanding expenses or liabilities, and divide the remaining net figure by the total number of units issued to investors.
Here is the standard mathematical formula:
Net Asset Value (NAV) = (Total Assets − Total Liabilities) ÷ Total Number of Outstanding Units
To understand how this works in practice, let’s look closer at what goes into each side of the equation.
A mutual fund’s total assets represent the combined market value of everything the scheme owns. This includes:
A fund incurs daily operational costs and obligations that must be deducted. Liabilities include:
This is the total quantity of units allocated across all investors holding shares in the fund scheme.
Let’s look at a practical example to see how the arithmetic works in real life.
Imagine an equity mutual fund called the Sterling Growth Fund:
First, subtract the total liabilities from the total assets to calculate the overall net value of the portfolio:
Total Net Assets = $50,000,000 − $1,000,000 = $49,000,000
Next, divide this net figure by the total number of outstanding units:
NAV per Unit = $49,000,000 ÷ 2,000,000 = $24.50 per unit
The published NAV for the Sterling Growth Fund on that day is $24.50. If you decide to invest $1,000 into the fund that day, you will be allocated approximately 40.81 units.
Mutual fund NAVs are updated once every business day after the stock markets close.
Throughout normal trading hours, the share prices of companies inside the fund move up and down. Fund managers wait for market close so they can take the final closing prices of every holding to ensure an accurate calculation. Once the valuation process finishes in the evening, fund providers publish the new NAV across official investment platforms and financial websites.
Unlike individual stocks where you buy at an exact second-by-second price, mutual funds operate on a forward-pricing model. If you place a purchase or redemption request before the daily cut-off time (usually early afternoon), your transaction is executed using that same day’s closing NAV. If your order arrives after the cut-off time, it gets processed using the next business day’s calculated NAV.
Because NAV looks like a stock price, beginner investors often make the mistake of treating it like one. Let’s clear up the three most widespread myths.
In stock trading, buying a share at $10 often feels cheaper than buying one at $100. In mutual funds, this concept does not apply.
A fund with a NAV of $10 is not better value than a fund with a NAV of $100. A lower NAV simply means the fund is newer, or that it has issued more units over time.
For instance, if you invest $1,000 in Fund A (NAV $10), you receive 100 units. If you invest $1,000 in Fund B (NAV $100), you receive 10 units. If both underlying portfolios grow by 10% over the next year, your investment in either fund grows to exactly $1,100. The starting unit price has zero impact on your actual returns.
Conversely, a high NAV does not mean a fund is overpriced or has run out of room to grow.
A higher NAV usually indicates that a fund has a long operational history and has consistently accumulated compound growth over many years. It reflects past success rather than an inflated valuation.
Some investors actively seek out new fund offers or low-NAV funds, believing it is easier for a $10 unit to double to $20 than for a $100 unit to reach $200.
This is a classic misunderstanding. Growth is driven entirely by the percentage performance of the underlying stocks and bonds inside the portfolio, not by the nominal unit price of the fund.
When analysing individual company shares, market participants routinely weigh technical vs fundamental analysis.
With mutual fund NAV, however, this dynamic shifts entirely. NAV is strictly an accounting output reflecting the collective fundamental valuation of the fund’s underlying assets. Because an open-ended mutual fund does not trade on an open bid-ask marketplace throughout the day, technical analysis chart patterns like “head and shoulders” or “support and resistance levels” do not apply to NAV numbers. You cannot analyse a fund’s NAV graph to time an entry point in the same way a day trader analyses a stock chart. Instead, evaluating a mutual fund requires a purely fundamental perspective examining the quality of the underlying securities, the economic conditions of the sectors held, and the overall management strategy.
If NAV doesn’t tell you whether a fund is cheap or expensive, why is it so widely monitored?
NAV serves several practical accounting and operational functions:
NAV should never be used to judge a fund’s quality, choose between two competing funds, or predict future growth. Using NAV to select a fund is like picking a book based on the page count rather than the story inside.
Rather than concentrating on unit prices, evaluate these core factors when choosing a mutual fund:
Mutual fund NAV is one of the most fundamental concepts in personal investing, yet it remains widely misunderstood. Rather than viewing NAV as a signal of value or performance, treat it as what it truly is: a practical daily accounting metric that prices your units and tracks your portfolio value. By ignoring unit price noise and focusing on portfolio quality, low fees, and long-term discipline, you will build a far stronger investment strategy.